

Blog
SWA participated in a “blind” study that analyzed a number of today’s common exhaust fans. The study emphasizes the importance of fan selection. With this understanding, we will then discuss solutions and best practices for installing bathroom exhaust ventilation.
If you recall from Part 1 of this article written back in September, we discussed why exhaust fans often don’t operate as they are intended. Now, let’s discuss how to rectify these issues. First, we need to understand that all fans are not created equal. To do this, SWA participated in a “blind” study that analyzed a number of today’s common exhaust fans. The study emphasizes the importance of fan selection. With this understanding, we will then discuss solutions and best practices for installing bathroom exhaust ventilation.
To get a comprehensive performance dataset for a number of exhaust fans, the Riverside Energy Efficiency Laboratory (REEL) was engaged for a “blind” study. REEL is the HVI/ESTAR neutral, third-party testing facility. In total, 7 multi-speed fans, 7 single speed fans, and 6 low-profile fans from six manufacturers were sent to REEL without manufacturer markings. In general, ten-point airflow tests were conducted on each fan. Testing adhered to standards used in the industry, namely, ANSI/AMCA Standard 210 and HVI Publications 916 and 920, where applicable. While the dataset is extensive, this paper focuses on the 50, 80, and 110 cfm ventilation rates, as these are the most common specified fan speeds for bathrooms. These fan curves show the relationship of airflow that will be delivered at various static pressures of the duct system.
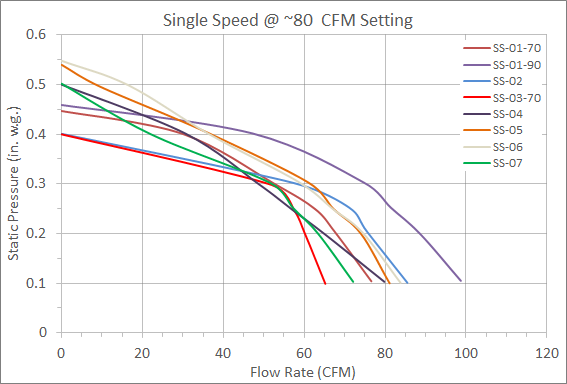
Figure 1 shows fan curves for single speed fans that were tested. The units are rated for 80 cfm unless noted otherwise in the legend (two are rated for 70 cfm and one for 90 cfm). While all of these fans performed in a similar manner, would it surprise you that two of the fan curves in Figure 1 are for exhaust fans that use DC motors? People often assume that all fans using DC motors are the same and result in constant airflow for a range of static pressures (let’s say up to 0.4” w.g.).

It is clear in this data (Figure 1) that flow rates decrease rapidly when static pressure rises over 0.3” w.g., as it often does in real world installations. Oh, are you still wondering which two fans have DC motors? It is actually SS-05 and SS-06. A bit surprising, isn’t it?
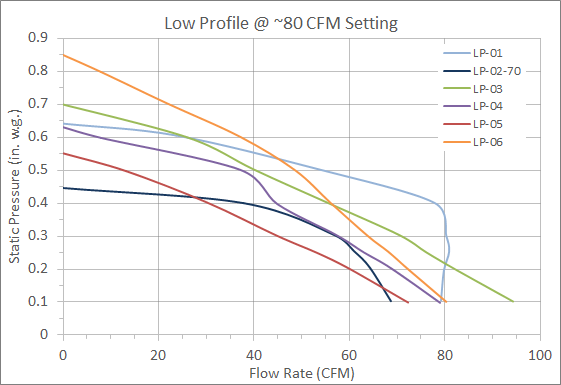
Low-profile exhaust fans have become quite popular due to the low clearance requirements for these fan housings. However, as shown in Figure 2, only one fan (LP-01) that uses a brushless DC motor was able to maintain the 80 cfm performance at static pressures up to 0.4” w.g. The rest of the fans (including LP-04, which also uses a DC motor) show a steady degradation of airflow as the static pressure increases over the 0.1” w.g.
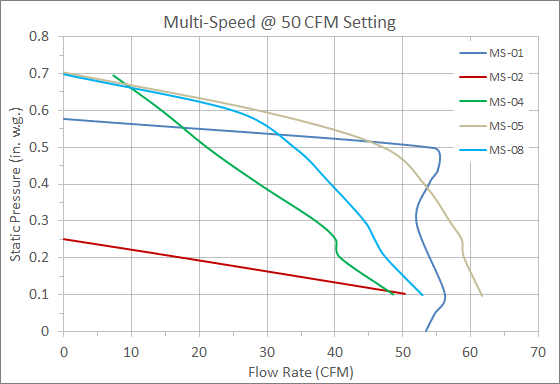
For multi-speed fans, the fan curves for the 50, 80, and 110 cfm fan settings are shown in the following charts (if test data was available), as they are the most common flow rates specified for bathrooms. Figure 3 and Figure 4 show the performance of tested multi-speed fans operating at 50 cfm and 80 cfm settings, respectively. All of the multi-speed fans incorporate a DC motor except one (MS-02). For the two better performing fans (MS-01 and MS-05) at the 50 cfm setting, the rate of flow degradation only increased significantly once static pressure exceeded 0.5” w.g.
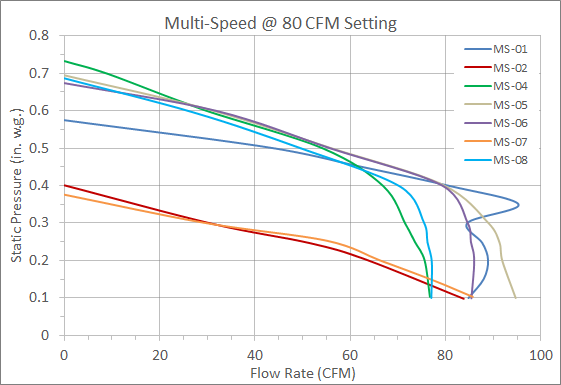
For the five better performing DC motor fans at the 80 cfm setting, the rate of performance degradation for these multi-speed fans did not increase significantly until static pressure exceeded 0.4” w.g.
Test results for multi-speed fans at the 110 cfm setting are shown in Figure 5. Two fans delivered rated flow rates until static pressures reached approximately 0.3” w.g. (MS-01, MS-05). At lower speeds (and air velocities) these fans could maintain rated flow rates at approximately 0.4” w.g.
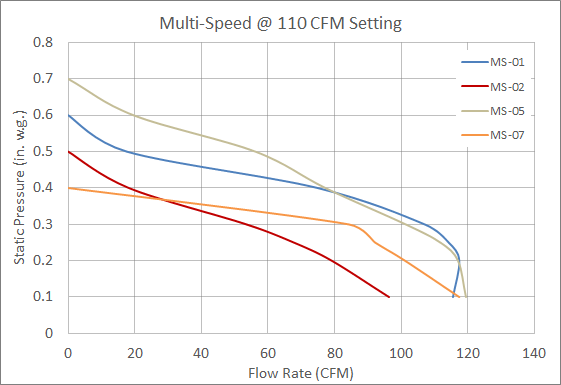
For the majority of the multi-speed fans, exhaust airflow tended to be more consistent up to 0.4” w.g. at the middle range (~80 cfm) of their available speed settings. At other speeds, the rate of fan degradation with respect to rises in static pressure seems to be more drastic.
While the data shows that some fans with DC motors have better performance, there is often this misconception that all DC motor exhaust fans maintain the rated flow rate nearly perfectly in all installation scenarios. This is simply not the case. Performance is really dependent on the specific fan model. Therefore, fan curves for specified equipment need to be reviewed along with calculations of the static pressure drop (a ductulator can be used) based on the anticipated ventilation duct components and pathway.
Exhaust fans are the primary method to remove odors and pollutants—especially water vapor—from bathrooms. However, these fans often perform very inefficiently and poorly—exhausting a very small fraction of the design or desired flow rates. Better design and installation of exhaust fans is certainly needed. Here is a handy one-pager that we often provide to design teams.
Even with the best installation practices, the only way to ensure success of exhaust fans is by actually verifying performance. Commissioning of exhaust fan operation is usually very straightforward. First, verify that the fan actually turns on when switched on (or when programmed to turn on). Exhaust air flow rate can be easily measured with a flow hood[2] or flow meter (Figure 6). If delivered flow rates do not match design rates (within ~10 cfm), inspect the duct system (when possible) to see if there are any obstructions, if back-draft dampers are operating properly, etc.
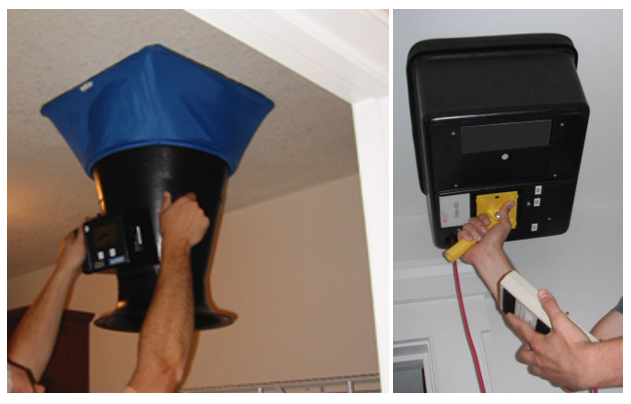
It can also be beneficial to measure flow rate at the outdoor terminal of the duct run. A large disparity in measured flow rates between the exhaust fan and termination measurement implies leakage. If possible, trace the exhaust duct run and inspect for disconnects, crimps, leaks, etc.
Finally, it would be beneficial if fan manufacturers tested and reported performance at higher static pressures to better reflect real-world installations. Exhaust fans are commonly specified based on rated performance at 0.1 or 0.25” w.g. However, as the airflow increases above 40 cfm with 4” duct, 0.1” w.g. is rapidly approached or exceeded simply with the inclusion of a termination cap (roof cap typically being more restrictive than a wall cap); never mind the rest of the ductwork and typical poor installation practices.
To demonstrate how fans typically perform in real-life scenarios, SWA ran tests on a multi-speed fan set to 80 cfm and attached ducts to approximate “typical” installations. A 4” insulated flex duct was connected to the exhaust fan. A straight, 90°, or 180° bend (2 diameter bend radius) was placed right after the exhaust fan. The rest of the 20ft. flex duct was run straight, either taut () or loose (). At the end of 20 feet, a typical metal side wall termination cap was installed. Figure 7 shows the exhaust fan curve versus the in-house testing by SWA. Except for the short 8 feet of straight ductwork to a side wall cap (equaling ~48 feet of total equivalent length of ductwork), all cases resulted in a static pressure of greater than 0.25in. w.g. For these tests, switching to a roof cap termination with a 90° bend and 4 feet of rise at the end of the flex duct resulted in an average static pressure increase of ~0.07” w.g.
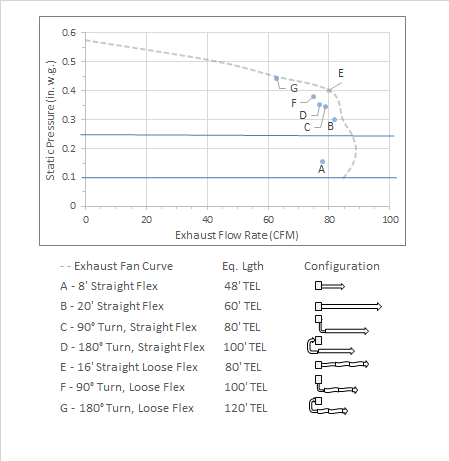
It would behoove the industry to move away from the 0.1” w.g. rating, consider the 0.25” w.g. rating as the new minimum performance rating baseline, and provide a 0.4” w.g. rating value to better represent common installation scenarios.
For more information, please contact us.
[1] It is unclear if the 0.35″ w.g. data point for the MS-01 fan is an accurate measurement or if the lab technician may not have allowed the fan speed to stabilize before taking the reading.
[2] There can be challenges to measuring exhaust airflow of a DC motor exhaust fan with a powered flow hood; as the fan and powered hood may keep trying to compensate for each other.
Contributor: Srikanth Puttagunta, Principal Mechanical Engineer
Steven Winter Associates