

Blog
There are lots of resources available on how to reduce home energy use. You can look at program requirements and guidelines like the Zero Energy Ready Program or Passive House. Through modeling I will demonstrate how the energy use numbers change and describe what we have seen in real-world examples of net zero homes.
I recently performed some net zero energy modeling on a single-family home for work. Around the same time, I got to chatting with my neighbor (mindful of social distancing) and when I mentioned net zero, he said, “Is that even possible?” AH! Get the word out. We have the means to offset our home energy use. What follows are the basics to consider when trying to fully offset home energy along with a breakdown of how different upgrades can affect energy use.
There are lots of resources available on how to reduce home energy use. You can look at program requirements and guidelines like the Zero Energy Ready Program or Passive House. Through modeling I will demonstrate how the energy use numbers change and describe what we have seen in real-world examples of net zero homes. Net zero is not new and we’ll be looking at some specific pieces of single family home modeling.
To first clarify, the term “net zero” has a few different meanings. Are we considering electricity, water, BTUs, carbon, site energy, source energy, cost per year? For the purpose of this write-up, we’ll consider the total electricity use of a home. We can call it net zero site energy or net zero electricity. We aim to produce (typically through photovoltaic panels), on average, as much electricity as we use throughout the year — offsetting our kWhr/yr use. Conventional home designs “consume” electricity. Note that there is no “reduction to zero” strategy without offsetting (There are true passive designs that attempt this, but that’s another story.) However, if we produce as much as we consume throughout the year, then we are net zero electricity, or net zero kWhr. To be clear, with utility fees and not getting full credit from power companies for home PV production, net zero electricity does not necessarily mean net zero cost. Back to offsetting. What this means is you can always be net zero, you just may need a football field of solar panels out back. On the other hand, an inefficient (we’ll say code minimal!) home would almost certainly not have enough roof space to house the required number of panels to fully offset consumption. It would also be a significant portion of the house cost to pay for an array that size. What we want to do is, as always, first reduce as much energy use as we can through better design. At that point, we’ll need a much smaller array to offset our use, making it much more achievable.
Let’s also understand that this is different from “off the grid.” When installing solar panels on a home, the design is not intended to provide electricity for everything you use in real-time. Instead, there is usually a net metering strategy. Essentially, your home uses electricity every day and the utility company measures that use on your meter. Your solar panels produce electricity and pump it back to the grid. We will not go into the details here – you’ll definitely be able to find your own rabbit hole on the internet for that.
So, we want a net zero house. Let’s simplify and consider new design and construction, though all the discussed efficiency measures could apply to a renovation, it just might be more complicated. Not surprisingly, the recommendations are to insulate well, air seal well, choose a high efficiency heating and cooling systems and high efficiency water heater, and select efficient lighting and appliances. A heat recovery (or energy recovery) ventilation system is also important.
Below is a quick breakdown of a few main design components. This is taken from four constructed net zero homes, which were primarily in Connecticut, and two energy models in northern Maryland. The location can definitely change what is more important, but we’re generally looking at the same elements.

This should give you an idea on where to aim when you are designing for efficiency. None of these elements are extremely innovative. In most cases we’re also not talking about prohibitively expensive changes. This is especially true if we consider smaller loads (smaller HVAC equipment) and, of course, reduced operating cost. You’ll also see some basic trends. Now for the fun part. Let’s do some modeling and break those down. For the purposes of the numbers, I’m going to look at the same home, with ~2009 code minimum parameters, and then compare that to different upgrades (energy conservation measures or ECMs). Most of the baseline comparison is performed with an all-electric baseline model, though I did perform some comparisons with a gas model during my research. My “efficient model” type is all-electric. To read a little more on electrification you can see Nicole Ceci’s recent article here.
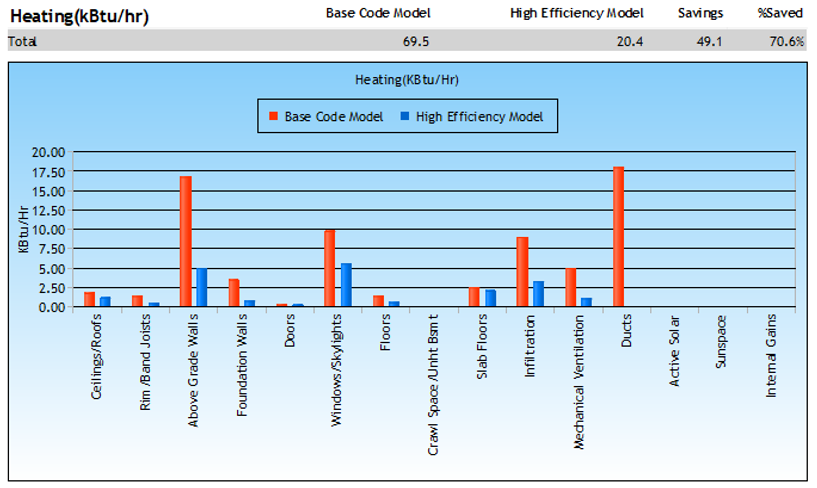
Here are the heating and cooling design loads of our base code model compared to the high efficiency (net zero target) model located in northern Maryland. Below that is the kWhr end-use consumption for the year.

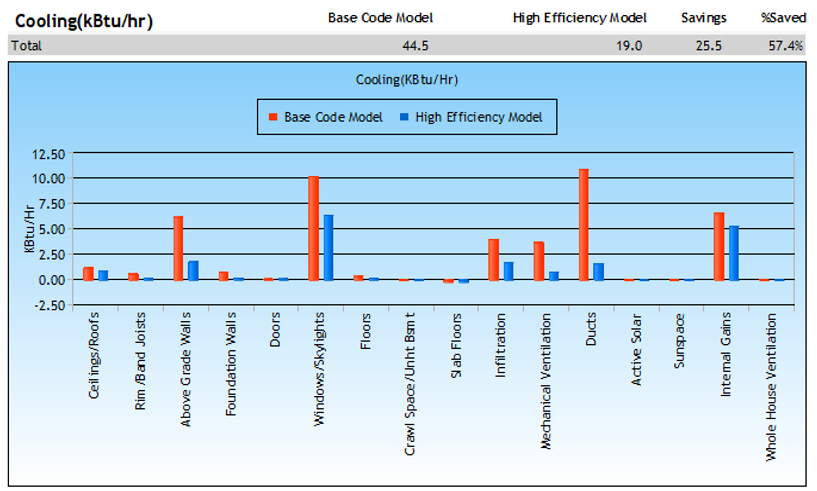

The initial numbers are pretty impressive. Compared to the energy codes for each state, our 2009 IECC baseline components are not uncommon (though MD is actually more stringent). Some components are obtained from the minimum values on an IECC insulation table, while others are assumptions, such as duct and blower door leakage. The code minimal home shows significant loads in walls, windows, infiltration, and ducts. For the base model, the ductwork is located outside the thermal envelope (in an attic) and is fairly leaky, but actually below many numbers I have personally tested. The efficiency model fully halves many of the loads for these components. You can see the overall end-use kWhr/yr is 55% less! Water heating load dropped 77%! We could surely use our yard to install about a 23,500 Peak-Watt PV system to fully offset the load and create a “code minimal” net zero home, but wouldn’t it be nicer to install a ~10k Watt system on the roof? And this is for a ~4,000 sf, 5 Bedroom home with moderate upgrades. Smaller homes or townhomes with less exterior wall area are significantly lower. OK, so what did we change? (Array size calculated with assumptions in REMrate software)
Let’s go back to our specs. We had typical R-13 batts installed in a 2×4 @ 16” o.c. framing. Changing this to a 2×6 wall allows for 24” stud spacing and R-21 batts. We added 3” of R-5 insulation on the exterior (R-15). Our roof went from R-38 to R-60. Our windows went from U-0.35; SHGC-0.40 to U-0.20; SHGC-0.26. We started with a heat pump to make the base model all electric. We upgraded our base from two units at 8.2 HSPF; 14 SEER to one unit at 11 HSPF; 19 SEER. Our electric resistance tanked water heater changed to a HPWH, and we installed an ERV instead of having our fresh air come from the leaky nooks and crannies of an exhaust-only approach. The ducts were pulled inside the conditioned envelope and tightened up. All the lighting is CFL.
These are pretty obvious upgrades.
Looking at some of the individual numbers paints a more detailed picture. The HPWH saved 3,071 kWhr according to the model. This is over 10% of the entire initial home load for upgrading a single piece of equipment! In addition, there are some moderately low-flow fixtures and hot water piping insulation. Running comparison numbers against other ECMs, the HPWH saved more than installing an inch of exterior insulation (~1,900 kWhr reduction) or dropping the infiltration down to 1.5 ACH (~1,750 kWhr reduction). That’s almost twice the savings achieved by our windows (~1,480 kWhr reduction)!
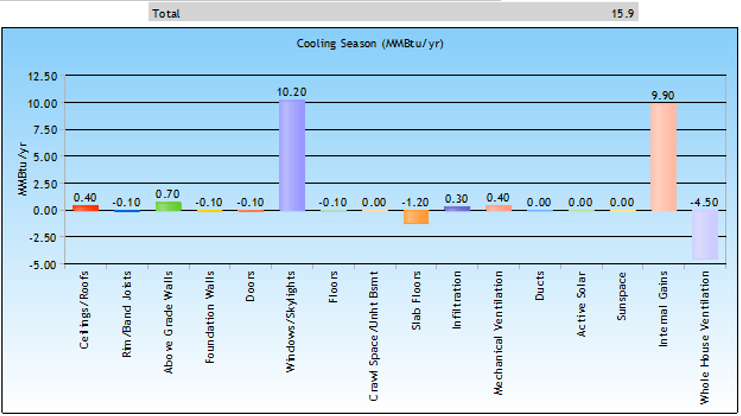
What is interesting about windows is that for our high efficiency home, while they may be tied for third place in terms of highest components of the heating load, they are our largest component of cooling load (see component load chart below). And considering we have little control over internal gains, windows (specifically solar heat gain t for cooling) affect the cooling load more than any other component we are able to control. Addressing this may mean reducing window size, specifying a better SHGC, but also including shading components and considering orientation in the design. To geek out on window specifics, feel free to read Chris Hamm’s post.
Installing both an Energy Star washer and dryer dropped our total load by over 800 kWhr, and we only used moderate ESTAR efficiencies. Check out the Energy Star Product Finder for dryers, that our 4.0 CEF is well under the highest efficiency 6-9 CEF.
Lighting saved ~800 kWhr/year, but here we run into some modeling restrictions. The REMrate software version I am using can only account for 100% CFLs as the most efficient option. As we get into later versions and other software, we can start accounting for LEDs and lighting controls, which save additional energy. Aside from lighting, we can also get even more granular and consider elements such as efficient hot water distribution, on-demand hot water, proper window shading, specifying the highest efficiency appliances, and event accounting for a reduced framing factor (less thermal bridging) for our energy efficient framing installation.
There are also quite a few assumptions the software makes. This is a five-bedroom home. That means it assumes accounting for six people for water use, plug loads, appliances, etc. If we change our base model from a five-bedroom to a two-bedroom to mimic how a family of three would live, we have about an 8% overall reduction in kWhr/yr. Our high efficiency model is similarly reduced by about 7%. The program assumptions are not unreasonable considering how many different types of homes and different types of people live in those homes. However, this brings us to a big piece of the energy pie.
If we are not satisfied with our 13kW system, then what can we continue to reduce (aside from the smaller categories above)? If you look back at the end-use consumption, there are only a few categories. The largest by far (60% of the total load of this efficient home) is plug loads!
“Plug loads” cover anything not already accounted for that could be plugged in such as computers, TVs, toasters, audio systems, etc. Plug loads in some energy models include lighting if the lighting is not hard wired. What is unfortunate about our modeling software is that we have little control over plug load entries. What is unfortunate about overall accuracy, is that this is one of the largest fluctuations in energy use in a home. The software conservatively estimates on the high(er) end, but this baseline energy use can fluctuate widely. Looking at the ACEEE research below, we can see that miscellaneous energy loads (MELs) account for the largest portion of kWhr/yr consumption in measured homes.
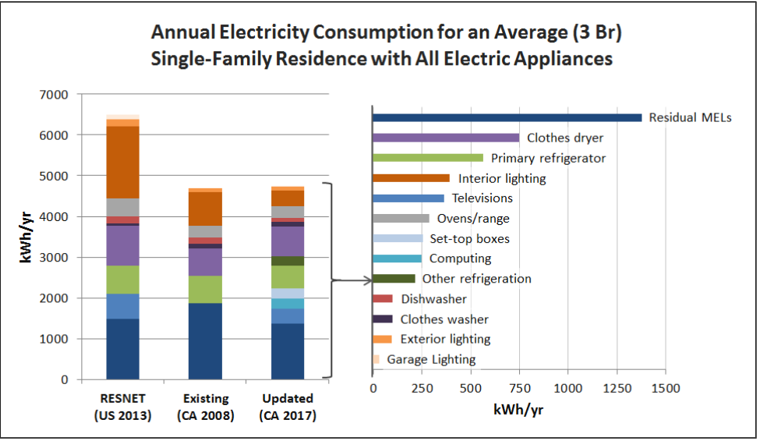
Table source: https://www.aceee.org/files/proceedings/2016/data/papers/1_1069.pdf
E-Source research uses US DOE data to show the devices that have the highest active power draws (when being used), but also the highest use by consumption. This can include a significant portion of energy on standby or simply continuous use, such as a security system.
If we’re designing for the smallest kWhr use possible, we should not only consider design plan elements such as insulation, window shading, and water heating, but also user choices, such as audio systems and aquariums!
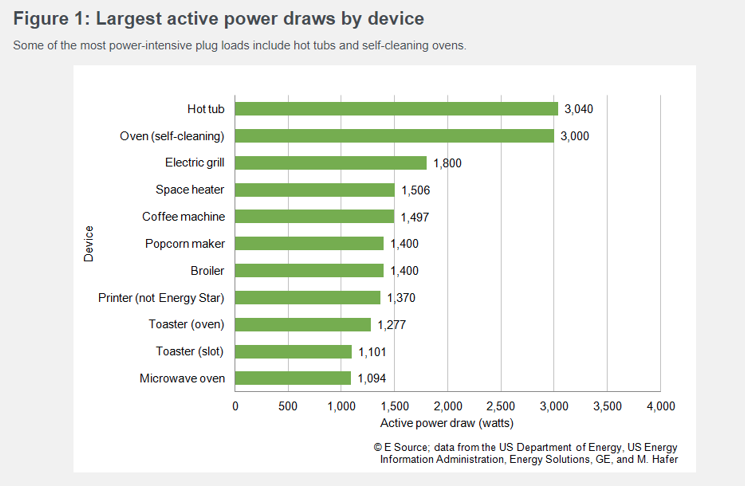
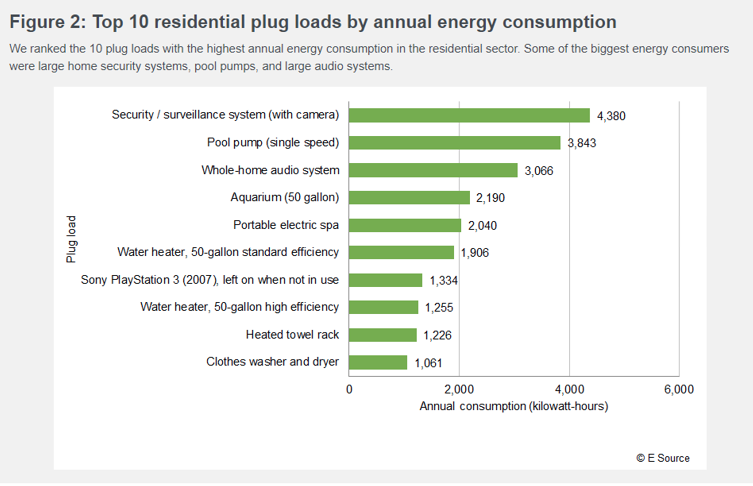
Graph source: https://www.esource.com/tas-1700025-001/powerful-pull-plug-loads
Of course, there are many other pieces of this glorious environmental pie to consider. We’ve mentioned some here but didn’t go into detail. How is your indoor air quality? Are your materials contributing to a healthy indoor environment? What is your refrigerant’s global warming potential? Isn’t using gas cheaper? How is the chosen location for greenery, local community resources? If carbon is your end game, then adding lots more insulation may not actually be the best choice! There is the embodied carbon of insulation to consider. We didn’t even get into ventilation systems. The list goes on and on. Please feel free to read our other Party Walls entries and listen to our podcast to get the deep dive on some of those topics.\
In summary, we know the main ways to reduce energy in home design. We also know that through modeling, we can evaluate more granular design elements to consider to further reduce our energy use. Each building is different and each user is different. And with solar continuing to decline in price and the emerging community solar market.it is becoming easier and easier to get to net zero. Tell your neighbors!
Contributor: Joseph Andracchio, Senior Sustainability Consultant
Steven Winter Associates