MENU

Party Walls

Trends in Healthcare: Nurse Call Devices

“Trends in Healthcare” is a recurring series that focuses on exciting new designs and technologies we’re seeing in healthcare projects and provides best practices on how to ensure that these latest trends are accessible to persons with disabilities. We build on the wealth of knowledge we gain from working with healthcare design teams, construction crews, and practitioners to provide practical solutions for achieving accessible healthcare environments.


According to the U.S. Centers for Disease Control and Prevention (CDC), falls account for 3 million injuries treated in emergency rooms, 800,000 hospitalizations, and 28,000 deaths each year in the U.S. One in five falls cause serious injuries such as concussions/traumatic brain injuries and hip fractures. Not only is this a public health concern, it is extremely costly. According to the CDC, medical costs directly related to injuries resulting from falls totaled more than $50 billion in 2015.[1] Within hospitals and long-term care facilities, effective implementation of interventions and design strategies to reduce patient falls are key to increased patient safety and decreased medical costs. However, it may not be possible to eliminate patient falls altogether, so features like a properly installed nurse call system can be life changing.[2]

Accessible Nurse Call Stations

Most state and local standards and regulations require nurse call devices in each public toilet room and within inpatient bath, toilet, and shower rooms.[3,4] Where provided in spaces required to be accessible, the nurse call device must also be accessible. An accessible nurse call device is one that meets the following requirements: (more…)

Benefits of Water Metering and Water Monitoring

Water monitoring can quickly become a building owner’s best friend. The high cost of water bills can often overshadow the cost of fuel and electricity bills, but ownership and management often believe that the price of their water bill is simply something to deal with. Many building owners pay the water bill for the entire building directly to their local utility without being aware of what’s going on inside their building or what they’re actually paying for. After all, without water monitoring, how would they know?

Water monitoring can impact an owner’s bottom line due to the high costs of leaks, which are more pervasive than you’d think.

Types of Leaks

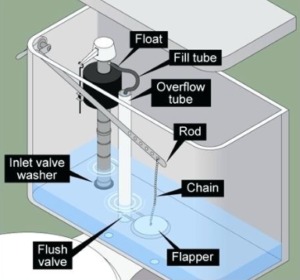
Image of toilet with components labeledWhile any water fixture can contribute to leaks and high water bills, toilets are typically the worst offenders. In toilets, rubber flappers can wear out, a flapper connected to the flush handle can have an incorrectly sized chain interfering with the seal, float mechanisms on the flush valve can be set too high causing the water level to go just above the overflow tube, or there can be tenant tampering.

Showers and sinks can also start leaking at any time. While typically at much lower capacities, these leaks can actually be easier to detect. By monitoring the water consumption in a building and observing hourly usage overnight, you can identify patterns that can quickly indicate a leak, eliminating the need to visually inspect all water fixtures in a building to determine the cause.

Cost of Leaks

The idea that a single leak can last for an entire year may seem unreasonable, though the sad truth is many leaks can go undetected and/or unreported. To put water leaks into perspective, the chart below from the NYC DEP details the potential extent of leaks and their costs on a daily and yearly basis:

(more…)

Establishing Moisture Control in Multifamily Buildings

Most of us are familiar with the feeling of a humid apartment after taking a hot shower. Some of us kick on an exhaust fan, perhaps un-fog the bathroom mirror, or even open a window to get the moisture out. Domestic moisture generation—moisture from human activity—is a major factor driving the humidity levels in our residential buildings, especially in super air-tight, Passive House construction. Before diving into just how much of an impact domestic moisture has in our buildings, let’s first look at average daily moisture generation rates of a typical family of three[1]:

  • breathing and transpiration—6 to 9 pounds of water vapor/day;
  • 10-minute shower in the morning for each individual—3.6 pounds of water vapor;
  • cooking fried eggs and bacon for breakfast—0.5 pounds of water vapor;
  • cooking steamed vegetables with pasta for dinner—0.5 to 1.0 pounds of water vapor; and
  • one small dog and a few plants around the house—0.5 pounds of water vapor/day

This brings the daily total to 11.1 to 14.6 pounds of moisture generation per day, or about 1.5 gallons of liquid water.

Where does all of this moisture go? In a typical code-level apartment building with moderate to high-levels of air leakage, water vapor has two year-round exit pathways: exfiltration through the façade and dedicated kitchen or bathroom mechanical exhaust. Additionally, in the summer, moisture is removed via condensate from the cooling system.

Let’s now put this in the context of a highly energy-efficient apartment with very low levels of air leakage (about 5 to 10 times less than the code-compliant unit), and balanced ventilation with energy recovery. The first means of moisture removal, façade exfiltration, is virtually non-existent given the building’s superior air-tight design. Next is mechanical exhaust ventilation in the kitchens and bathrooms. Because the unit has balanced ventilation and energy recovery, the exhaust air stream in a Passive House project typically passes through the energy recovery core. Depending on the core selection, a large percentage of the interior moisture may be retained in the apartment air despite the constant mechanical air exchange.

There are two basic types of cores:

  • Heat recovery ventilator (HRV) in which a certain percentage of sensible heat is recovered (transferred from the exhaust air stream to the supply air stream) while no moisture is recovered.
  • Energy recovery ventilator (ERV) in which a certain percentage of sensible heat and a certain percentage of moisture in the air is recovered.

To fully understand this issue, Figure 1 breaks break down the moisture-related pros and cons of ERVs and HRVs in the context of a high-density, Passive House building.

  ERV HRV
Pros Summer – prevents high exterior air moisture load from being supplied to interior air; cooling loads are minimized Winter – flushes high internal moisture load out of building; humidity levels reduced
Cons Winter – if internal moisture generation is high, interior moisture load is not flushed out of apartment; humidity levels increase Summer – allows exterior air moisture load to be supplied to interior air: cooling loads increase

Figure 1. Moisture related pros and cons with ERVs and HRVs in high efficiency, airtight construction


Traditionally, the key factor in deciding between an ERV or HRV for a high-efficiency building has been the project’s climate. However, as internal moisture loads begin to exceed exterior moisture loads in high-density projects, the decision between ERV or HRV must be looked at more closely for each project regardless of climate.

(more…)

ERV + AHU?

Everyone pretty much gets that continuous (or very frequent) ventilation is necessary in high-performance homes. And – at least in theory – most people get why balanced, heat recovery ventilation is better (than unbalanced and/or without heat recovery). But the devil’s in the details.

A couple years ago we started an R&D project with funding from DOE’s Building America program, and one of the first steps was interviewing several developers about ventilation (single- and multi-family residential, mostly on the East Coast). For none of these developers were HRVs or ERVs standard.[i] They all had some experience with ERVs, however, and when asked about these experiences the word “nightmare” came up shockingly often.

The ERVs on the market now can certainly work well in the right application, but we see problems more often than not. One of the biggest challenges is trying to add ERVs on to central heating/cooling systems in homes. Most ERVs aren’t really designed for this, and here’s what we see:

  • Ducts connected to the wrong places! Outlet and inlet ducts get reversed, or the supply air from the AHU getting exhausted (sad how often this happens).
  • ERVs are attached to supply and/or return trunks of the AHU. Unless the AHU fan is running constantly (or whenever the ERV is turned on), outdoor air comes into the AHU and is sucked right back out the ERV exhaust.
  • If the AHU fan is turned on, the relatively small fans in the ERV can’t successfully compete with the big AHU fan. People don’t get the ventilation flow rates they want and/or the flows are very unbalanced.
  • AHU fans can use A LOT of electricity. Hundreds of Watts is common – I’ve measured over 1 kW (though this is changing – more below).

Even if installers follow manufacturer instructions for attaching ERVs to AHUs, they could still end up with low flows, unbalanced flows, or high electricity consumption. Through this DOE R&D effort, we’re trying to do better.
(more…)

Does Your Exhaust Fan Suck? Part 2

If you recall from Part 1 of this article written back in September, we discussed why exhaust fans often don’t operate as they are intended. Now, let’s discuss how to rectify these issues. First, we need to understand that all fans are not created equal. To do this, SWA participated in a “blind” study that analyzed a number of today’s common exhaust fans. The study emphasizes the importance of fan selection. With this understanding, we will then discuss solutions and best practices for installing bathroom exhaust ventilation.

The “Blind” Study

To get a comprehensive performance dataset for a number of exhaust fans, the Riverside Energy Efficiency Laboratory (REEL) was engaged for a “blind” study. REEL is the HVI/ESTAR neutral, third-party testing facility. In total, 7 multi-speed fans, 7 single speed fans, and 6 low-profile fans from six manufacturers were sent to REEL without manufacturer markings. In general, ten-point airflow tests were conducted on each fan. Testing adhered to standards used in the industry, namely, ANSI/AMCA Standard 210 and HVI Publications 916 and 920, where applicable. While the dataset is extensive, this paper focuses on the 50, 80, and 110 cfm ventilation rates, as these are the most common specified fan speeds for bathrooms. These fan curves show the relationship of airflow that will be delivered at various static pressures of the duct system.

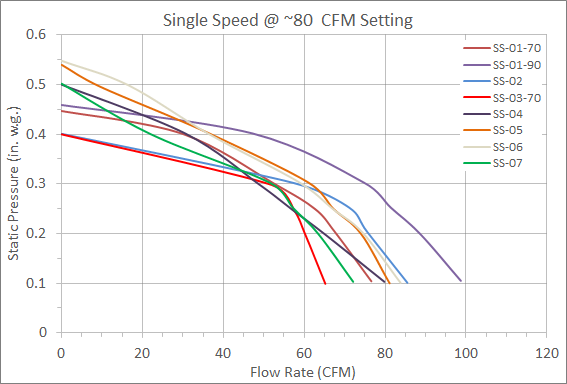
Figure 1 shows fan curves for single speed fans that were tested. The units are rated for 80 cfm unless noted otherwise in the legend (two are rated for 70 cfm and one for 90 cfm). While all of these fans performed in a similar manner, would it surprise you that two of the fan curves in Figure 1 are for exhaust fans that use DC motors? People often assume that all fans using DC motors are the same and result in constant airflow for a range of static pressures (let’s say up to 0.4” w.g.).

Figure 1

Figure 1. Performance Data for Single Speed Exhaust Fans

It is clear in this data (Figure 1) that flow rates decrease rapidly when static pressure rises over 0.3” w.g., as it often does in real world installations. Oh, are you still wondering which two fans have DC motors? It is actually SS-05 and SS-06. A bit surprising, isn’t it?

(more…)

Here’s What the Clean Energy DC Act Means for Existing Buildings in the District

Mayor signing legislationDistrict of Columbia Mayor, Muriel Bowser, signed a landmark piece of legislation known as the Clean Energy DC Omnibus Amendment Act this past Friday. With the mayor’s signing, Washington, DC becomes one of the first jurisdictions in the country with a binding, comprehensive law aimed at reducing greenhouse gas emissions. “It allows us to make significant improvements to the energy efficiency of existing buildings in the District,” Mayor Bowser said at the signing ceremony.

The new law has several sections which will impact the buildings in which DC residents and businesses live and work. In this post, we’re going to focus on Title III of the Clean Energy Omnibus Amendment Act, which is designed to make the city’s existing buildings more efficient.

(more…)

Here’s to Our Buildings, Our Health! SWA’s Top 10 Tips for a Healthier Indoor Environment – Part 2

Quick pulse survey: in the last three months, since we published our Part I blog on tips for healthier indoor environments, how many of you have either incorporated some of our healthy recommendations into your home, or informed your clients on the most effective ways to address health risks in buildings (hint: if you need a refresher, please visit Part I)?

As previously discussed, there is overwhelming evidence for the business case for healthier buildings, from greater employee productivity and reduced sick days in the workplace to reduced asthma incidents and ER visits for children living in green housing. Leading organizations know that improved wellbeing helps employees to be healthier and lowers healthcare costs. It also helps employees to be more productive, creative and innovative, and less likely to leave for a competitor. The same concept can be applied to tenants in rental buildings and condos.

Before we dive into health tips #6-10, here are some fun (and not so fun) facts to keep in mind while we spend winter days INSIDE our workplaces, schools and homes:

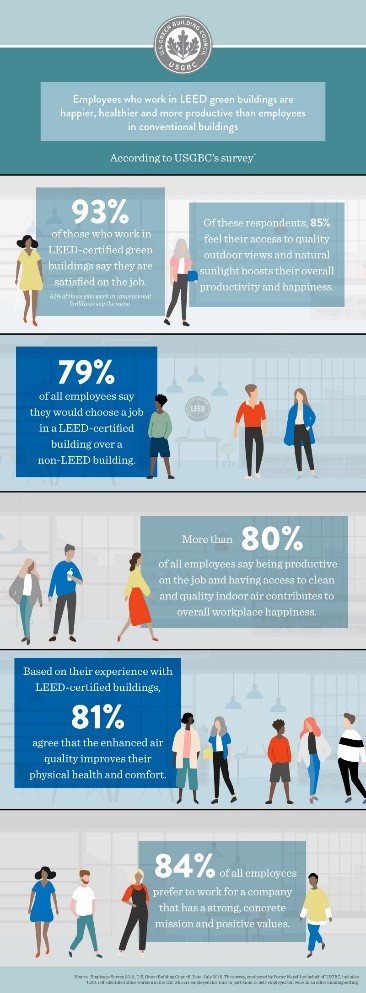
  • USGBC graphic with health statsIn the winter, school-aged children ages 11-17 will spend 60 minutes a day outdoors, compared to 175 minutes in the summer. (Source: Schools for Health by the Harvard TH Chan School of Public Health.)
  • In a study of 73 elementary schools in Florida, students in schools cooling with the noisiest types of HVAC systems were found to underperform on achievement tests compared with students taking tests in schools with quieter systems.
  • According to a recent survey released by the U.S. Green Building Council (USGBC), employees who work in LEED certified green buildings are happier, healthier and more productive than employees in conventional and non-LEED buildings:
    • More than 90 percent of respondents in LEED certified green buildings say they are satisfied on the job and 79 percent say they would choose a job in a LEED certified building over a non-LEED building.
    • More than 80 percent of respondents say that being productive on the job and having access to clean, high-quality indoor air contributes to their overall workplace happiness.
    • 85 percent of employees in LEED certified buildings also say their access to quality outdoor views and natural sunlight boosts their overall productivity and happiness, and 80 percent say the enhanced air quality improves their physical health and comfort.

(more…)

The Top 10 Party Walls Posts of 2018!

2018 has been a year to remember for SWA’s Party Walls blog. Our consultants have shared their passion for high performance buildings by recounting stories from the field and providing information, new findings, and best practices to improve the built environment.

Whether discussing topics based in New York City or Southeast Asia, here are our fan favorites from 2018…

Collage of blog images

(more…)

What is the Carbon Footprint of Your Holiday Shopping?

Have you ever wondered about the carbon footprint of your shopping habits? Is online shopping better for the environment than brick and mortar shopping? There are many studies on the subject and there are myriad factors to consider when answering these questions. To try and make this process a little easier, we have pulled together existing research and have developed a guide to reducing your carbon footprint this holiday season.

One 2013 study by MIT looked at the impact of online vs. in-store shopping for a few items (a t-shirt, a Barbie Doll, and a computer) and concluded that a few key factors can tip the scales in either direction. While this study ignored the impact of the embodied carbon of these items (more on this later), let’s look at the biggest factors that could contribute to your holiday shopping carbon footprint and factor into the store vs. online debate.

(more…)

Looking for a Fast Payback by Installing a Dedicated Domestic Hot Water System? You May Want to Look Elsewhere

Installing a dedicated domestic hot water (DHW) plant is a common energy conservation measure (ECM) in the New York City multifamily market. According to Local Law 87 data, approximately 80% of the audited multifamily floor area uses steam heating boilers to produce domestic hot water.[1] A recent SWA analysis of data from steam buildings with tankless coils that implemented this ECM suggests that auditors may want to think twice about recommending this measure widely.

Two unsupported arguments are typically made in favor of installing a dedicated DHW system.

  1. A new condensing boiler or water heater (we will just say “water heater” here for simplicity and to distinguish the dedicated system from the heating boiler) will operate at a very high efficiency.
  2. Scotch marine steam boilers are inherently inefficient and are plagued with high standby losses. Large Scotch marine boilers fire to meet small DHW loads, and correctly sizing a new dedicated water heater will eliminate short cycling.

(more…)

The owner of this website has made a commitment to accessibility and inclusion, please report any problems that you encounter using the contact form on this website. This site uses the WP ADA Compliance Check plugin to enhance accessibility.