
Blog
The Star Garments Innovation Center is now officially certified as a Pilot EnerPHit building, the building retrofit standard under the Passive House Institute (PHI).

Following up on our blog post in August 2018 – Just Your Typical Blower Door Test… in Sri Lanka – Star Garment Innovation Center – we have exciting news coming out of Sri Lanka. The Star Garments Innovation Center is now officially certified as a Pilot EnerPHit building, the building retrofit standard under the Passive House Institute (PHI).

EnerPHit certification for this project is a milestone achievement on many levels. The Innovation Center is now the first certified Passive House in Southeast Asia and one of only a handful of certified PH projects in tropical climates. PHI deemed the project “a milestone in industrial energy efficient retrofitting in a tropical monsoon climate.” Many of the passive measures employed at the Innovation Center, including continuous exterior insulation, highly efficienct windows, variable refrigerant flow heat pumps for cooling with wrap around heat pipe for enhanced dehumidification capacity, and balanced ventilation with heat recovery can be utilized across all future construction projects in tropical climates. The Passive House team here at SWA is excited to see the potential growth in tropical-climate Passive House construction as a result of the Innovation Center’s success.
But what good is certification if the building doesn’t perform as well as the energy model predicts? Well, we have exciting news on this front too!
At the very start of SWA’s involvement in the project back in the summer of 2016, SWA conducted a utility analysis of the base building prior to any renovations to predict and later verify the energy savings of the Innovation Center by designing to the PH standard. Once the energy model was developed, SWA predicted approximately 50% in energy savings when compared to the previous building’s energy bills.
Fast forward to Fall of 2018 and the building has now been occupied for a full year. The two inevitable questions are:
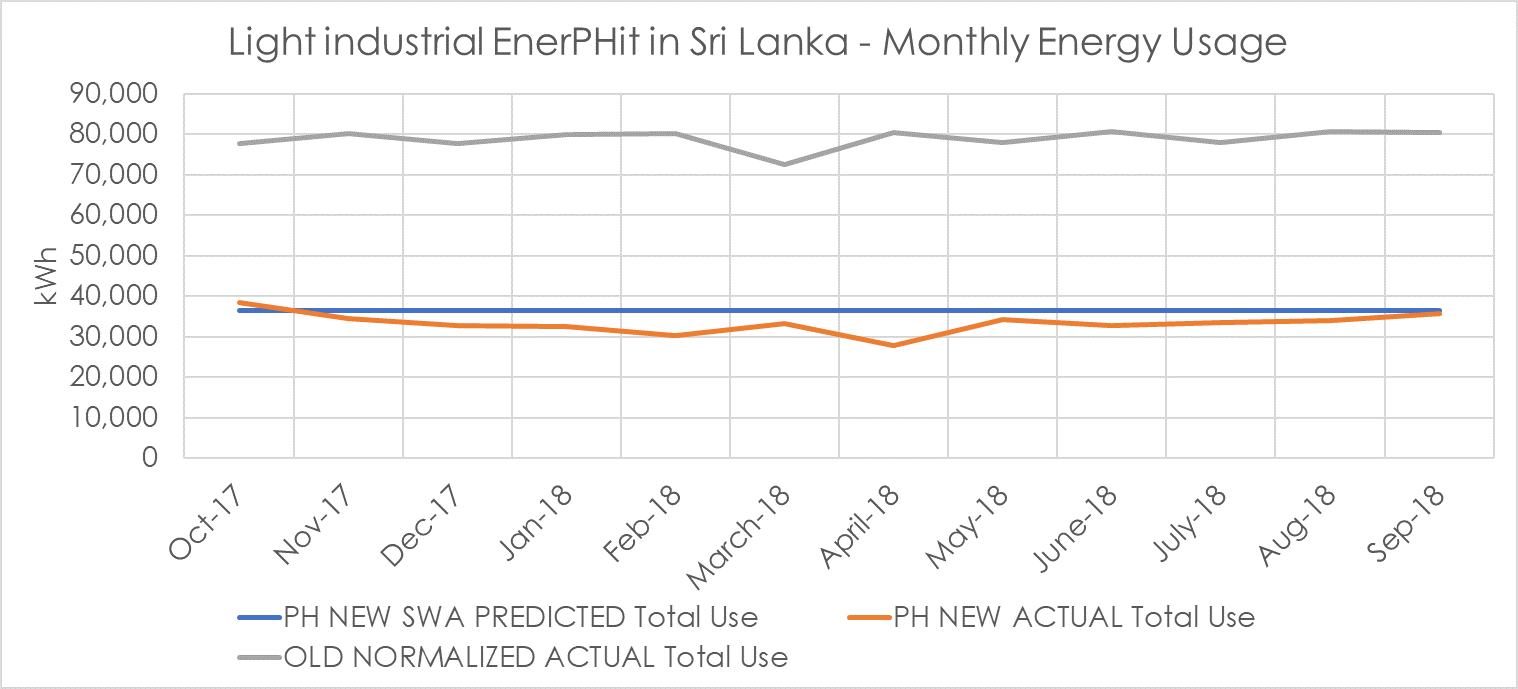
The figure below depicts monthly energy consumption of the following:

After a year of occupancy, the Innovation Center is saving approximately 54% in annual energy use when compared to the previous building. Also noteworthy, the monthly utility data is showing the Innovation Center use very close to what was predicted by the energy model – utility data is approximately 9% less than the predicted energy use on average over the course of the year.
In addition to using monthly utility data to verify expected energy cost savings, there is a plan in place to monitor end use-specific energy consumption to verify all building systems are operating at the expected performance levels. The Innovation Center is set up to be a leader in high performance building design for tropical climates and SWA is excited to be a part of this breaking story.
Dylan Martello